
SOUTH AFRICA – ECONOMIC PROFILE
OVERVIEW

South Africa stands as one of the leading economies in Africa, characterized by its diverse economic landscape and rich natural resources. It is situated on the southern tip of Africa. total area of 1,219,090 km² (470,693 mi²) and a total coastline of 2,798 km (1,738.6 mi). It is said to be one of the largest countries in Africa and the 25th biggest in the world wherein more than half of all residents (68%) live within cities.
SOUTH AFRICA – KEY STATISTICS
| Real GDP growth rate | 1.8% |
| GDP, current prices (billions of U.S. dollars) | 401.47 |
| GDP per capita, current prices (U.S. dollars per capita) | 6.43 thousand |
| GDP, current prices (Purchasing power parity; billions of international dollars) | 1.04 thousand |
| Population | 62.02 million |
| Inflation rate | 4.8% |
| Unemployment rate | 32.1% |
| Country Group | Developing/Emerging:
Upper-middle income |
| Language | 12 |
GDP, current prices (billions of U.S. dollars)
The GDP of South Africa in current prices is given as 401.47 and the GDP per capita, current prices (U.S. dollars per capita) is 6.43 thousand and the real GDP growth rate is 1.8%. The GDP flow throughout time is depicted in the graphic below, which reveals a varied pattern with multiple peaks and troughs. This could have been a result of global and economic fluctuations affecting the prices of goods and services provided as well as the trading patterns.
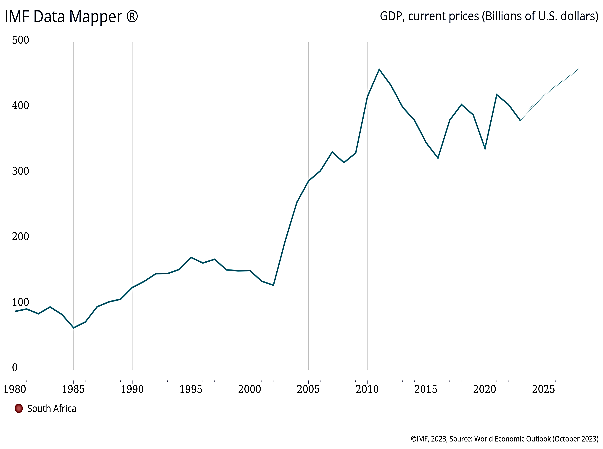 Fig: GDP, current prices (Billions of US dollar)
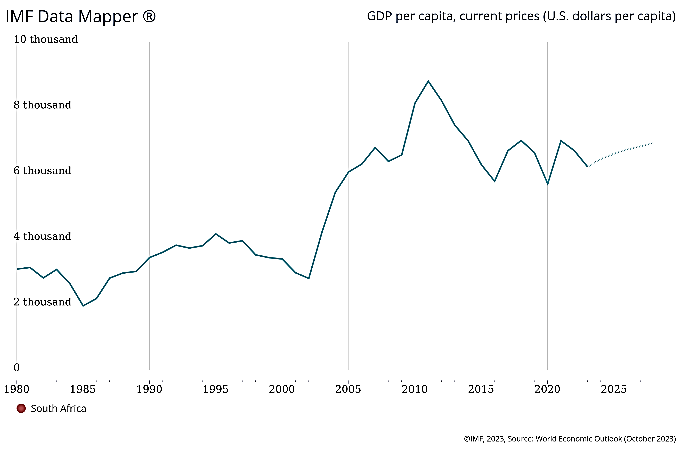
Fig: GDP per capita, current prices (U.S. dollars per capita)
Source: IMF
GDP, current prices (Purchasing power parity; billions of international dollars)
The GDP, current prices (Purchasing power parity; billions of international dollars) is 1.04 thousand. The PPP adjusts for the price level differences between the countries allowing for a more precise comparison. GDP calculated in this method caters to a higher amount than the nominal GDP for the developing countries, since the prices are lower in such countries than the advanced economies.
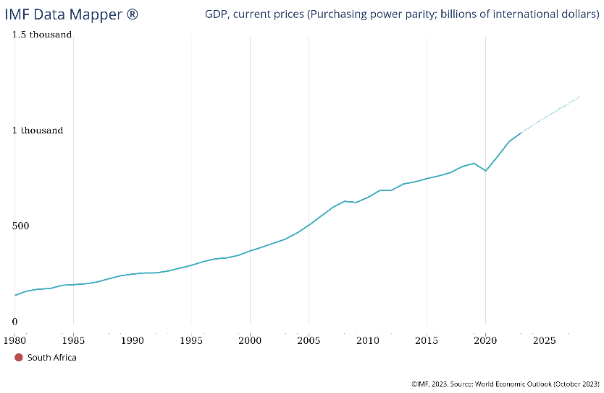 Fig: GDP, current prices (Purchasing power parity; billions of international dollars)
Source: IMF
Inflation rate:
The current inflation rate is 4.8%. The chart given below gives the trend of inflation rate over the given period. It is seen that there have periods of sharp increases and decreases in the inflation rate. The current trend reflects an uptick in the inflation rate which may be stabilized with suitable policies of the government.
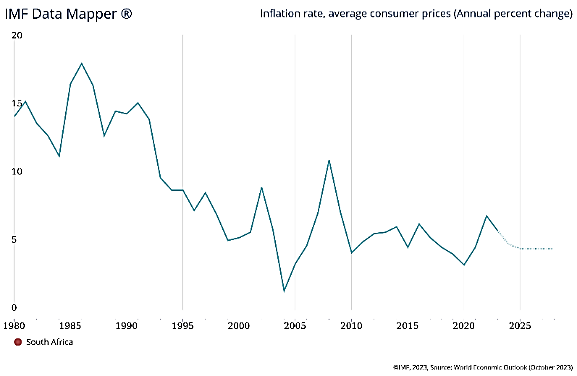
Fig: Inflation rate
Source: IMF
Unemployment rate
The current unemployment rate is 32.1% and over the years we can see as depicted that the unemployment rate has been increasing. This can be a result of several socio-economic and political factors prevalent in the country.
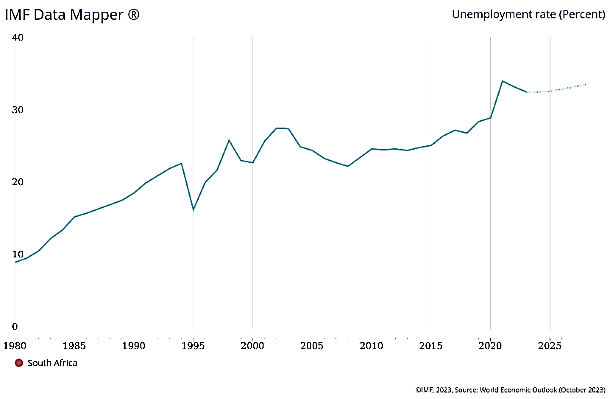
Fig: Unemployment rate
Source: IMF
TRADE
The South African trade mainly includes precious stones and metals and mineral products. Over the years, South Africa’s exports has been showing a declining trend as can be seen in the graph given below.
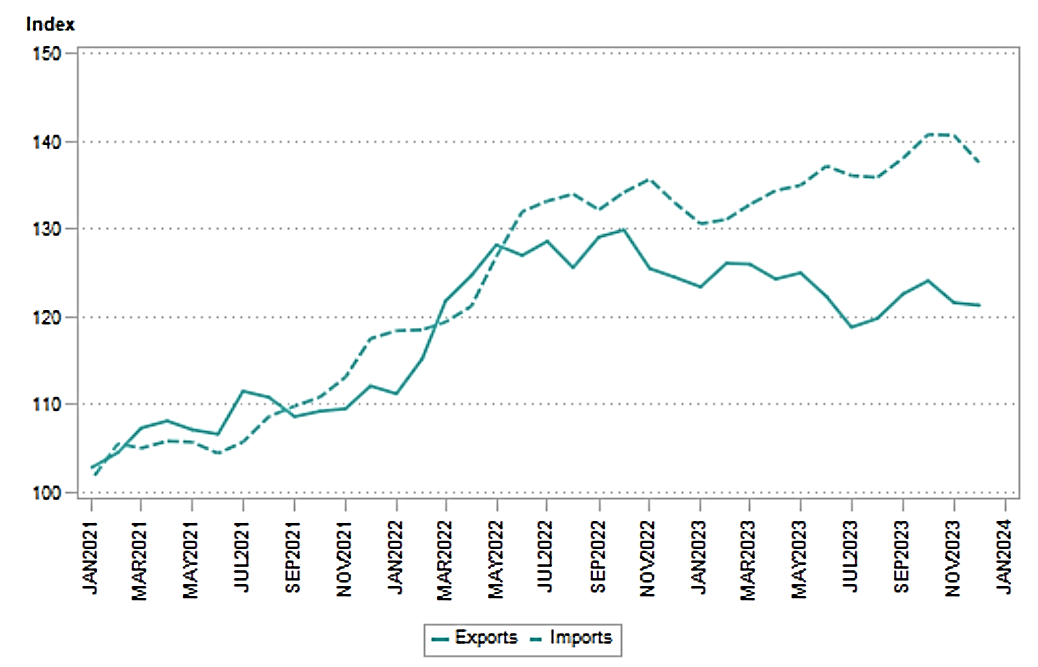 Fig: Export and Import Trend
Source: IMF
The exports for December 2023 stood at R163,971,594,667 and the imports were valued at R149,906,630,279. Reports suggest that in the recent years, the imports have been higher than the exports. The country majorly imports chemical products, transport equipment, etc. whereas the exports are limited to mineral products and precious stones.
The top exported and imported products have been shown below:
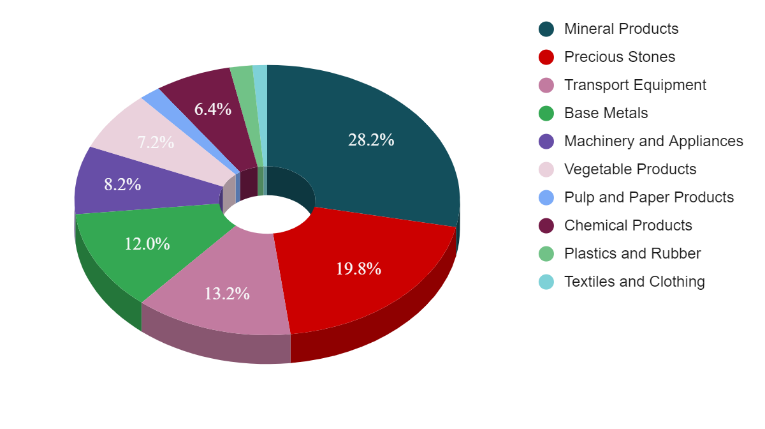
Fig: Top Exported products in 2023 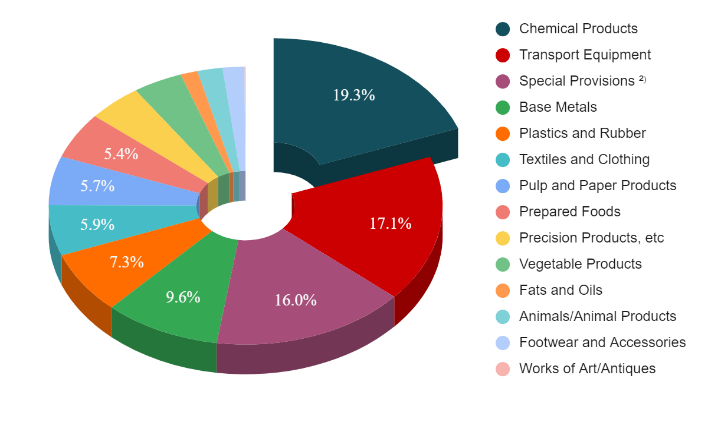
Fig: Top imported products in 2023
The top five trading partners of Nigeria with respect to exports and imports have been shown below:
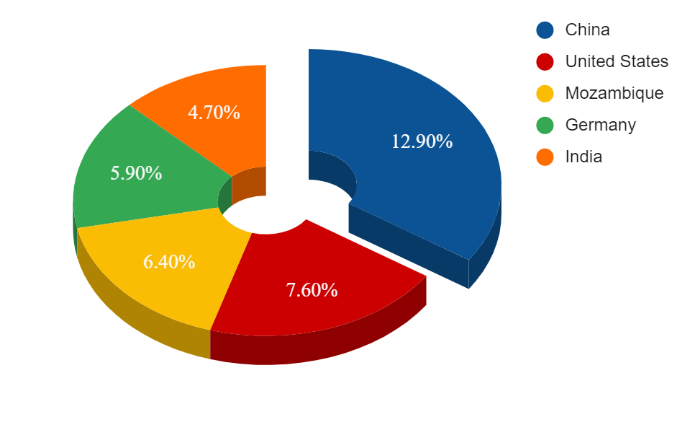 Fig: Top 5 Export Trading partners in 2023
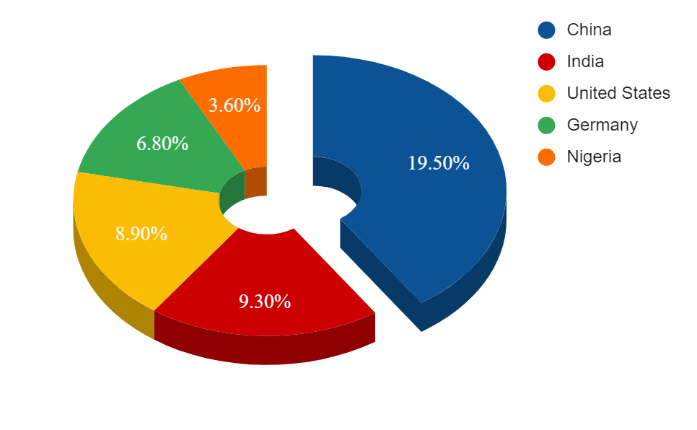
Fig: Top 5 Import Trading partners in 2023
As can be seen, China is one of the major trading partners of South Africa, and in recent years their bilateral trade relationship has become stronger. South Africa exports mainly gold, iron ore, and other mineral products to China. China also plays a role in assisting South Africa in recovering from the energy crisis by donating energy equipment worth around ZAR 167 million (USD 8.97 million) and a grant valued at around ZAR 500 million (USD 26.9 million). While Europe and Japan have well-established trade links with South Africa, trade with China is growing fast, including in financial services.
The United States holds significant importance as a trading and technology ally for South Africa, standing as the country’s third-largest bilateral partner in terms of the value of two-way trade. The African Growth and Opportunity Act (AGOA) grants duty-free access to the U.S. market for numerous Sub-Saharan African nations, including South Africa. Additionally, in 2012, the United States and South Africa entered into a Trade and Investment Framework Agreement (TIFA).
Below listed are some of the trade agreements entered into by South Africa:
Regional Agreements
- Southern African Development Community (SADC)
- Southern African Customs Union (SACU)
- African Continental Free Trade Agreement (ACFTA)
Existing trade agreements
Alliances
- African Union
- Non-Aligned Movement
- BRICS plus
- Commonwealth of Nations
- G20 – Developing Nations
- G20 – Group of Twenty
- UN – United Nations
- UNESCO
- WTO – World Trade Organization
NATURAL RESOURCES
South Africa is rich in mineral resources. It is said to be the world’s fifth-largest mining sector. South Africa is the largest producer of gold, platinum, and chromium with coal also forming one of the valuable minerals available in the country. There are large reserves of gold present, approximately 38% of the world’s reserves, wherein the production has been declining slowly in recent times due to exhaustion of resources.
The economy is also majorly dependent on coal, here electricity is majorly produced with coal, and also exports electricity to other Southern African countries. The hydroelectric potential is not yet utilised and steps have been taken to increase the production.
Given below are available resources and their quantity across the region:
| Gold Reserves | 125.41 tonnes |
| Coal | 9.9 billion metric tonnes |
| Platinum | 65 thousand metric tonnes |
| Chromium | 18 million metric tonnes |
| Diamonds | 9.6 million carats |
| Iron Ore | 76 million metric tonnes |
| Manganese | 640 million metric tonnes |
| Copper | 29,100 metric tonnes |
| Zinc | 193 metric tonnes |
SECTORAL PROFILE
The South African economy’s structure reflects its maturity, with a diverse mix of sectors contributing to its Gross Domestic Product (GDP). The largest sector is services, constituting roughly 73% of the GDP. This includes finance, real estate, and business services (21.6%); government services (17%); wholesale, retail, motor trade, catering, and accommodation (15%); and transport, storage, and communication (9.3%). Manufacturing makes up 13.9% of the GDP, while mining and quarrying contribute approximately 8.3%, and agriculture represents 2.6%.
Agriculture
South Africa has a diverse range of agricultural production, mainly due to the climatic conditions prevailing in the region. The major crops include grains, oilseeds, fruits, nuts, etc. The country also has a variety of livestock production. The major crops produced here are grains, which include maize, barley, wheat, oats, and sorghum. In recent years, agricultural production as well as the contribution to GDP has been declining. However, there have been efforts to revive this sector, by introducing digitalisation in agriculture, this aids in improving the efficiency of the crops by assisting the farmers, this includes agribusiness as well as Agritech.
Manufacturing
The manufacturing sector is one of the drivers of the South African economy, and a significant contributor to the GDP. Due to global challenges and economic factors, the share of this sector has been declining lately. This sector includes various industries such as Agro-processing, Automotive, Chemicals, ICT and electronics, Metals, Textiles, clothing, and footwear, wherein the automotive industry plays a vital role. Foreign investments are still a major source of funding for the automotive sector; in 2021, seven Original Equipment Manufacturers (OEMs) invested R8.8 billion, the second-highest amount ever recorded. The competent industry also made significant investments, amounting to R5.7 billion in 2021.
Mining & Quarrying
South Africa is a major supplier of Platinum Group Metals (PGM), coal, iron, manganese, chrome, and nickel. It also has certain Rare Earth Element (REE) deposits and related specialty refining infrastructure. This sector contributes around 8% to the GDP. This sector has high export possibilities due to its wide varieties and large reserves of minerals. However, this sector too is showing a declining trend mainly due to the changing government regulations and other socio-economic challenges.
Foreign Direct Investment
Among the African countries, the South African economy attracts significant portion of the Foreign Direct Investments from around the world. According to the South African Reserve Bank, the country received an FDI of ZAR 26 billion in the third quarter of 2023. The investments are received in various sectors such as battery storage projects, automotive industry, mining, manufacturing, finance, etc. The government has been providing various incentives such as tax allowances, subsidies, etc. to increase the foreign investments in the country. Traditionally, European countries are active investors in South Africa (United Kingdom, Netherlands, Belgium, Germany, and Luxembourg), as well as the United States, Japan, China, and Australia.
Fintech
South Africa is one of the upcoming economies in the world exhibiting a significant growth in the fintech sector, accounting to about 40% of all fintech revenue in Africa. Studies show that the digital assets will be holding the largest share in the market in 2024 with an AUM of US$ 373m. It is also seen that with the increased level of digitalisation and internet penetration in remote areas as well, almost 89% of the population have access to digital banking. The direction that FinTech is taking in South Africa is largely determined by both government regulations and incentives for financial inclusion. Achieving a sustainable development of the FinTech business requires striking the correct balance between protecting consumer interests and promoting innovation.
References
https://www.imf.org/external/datamapper/profile/ZAF
https://www.sars.gov.za/customs-and-excise/trade-statistics/
https://www.trade.gov/knowledge-product/exporting-south-africa-market-overview
https://globaledge.msu.edu/countries/south-africa/tradestats
https://oec.world/en/profile/country/zaf
https://www.britannica.com/place/South-Africa/Resources-and-power


